
In trading, technical indicators are essential mathematical tools for some and useless for others. Designed to analyze marketMarket A place where assets are bought and sold. movements and predict price trends, they primarily use the price and volume of an assetAsset Any digital asset, including cryptocurrencies. over a given period to highlight exploitable situations and allow the interpreter to draw conclusions. These indicators help identify overbought or oversold conditions, detect trend exhaustion, and understand market dynamics.
When to use indicators?
Technical indicators are generally divided into two categories: trend-following indicators and oscillators. The former, such as moving averages, are more effective in trending markets, while the latter, like the RSI, excel during consolidation phases. Each type of indicator has its strengths and weaknesses, and their use requires a deep understanding of market context. As a trader, you need to be aware of each indicator’s limitations and adapt your strategy accordingly.
Trend indicators
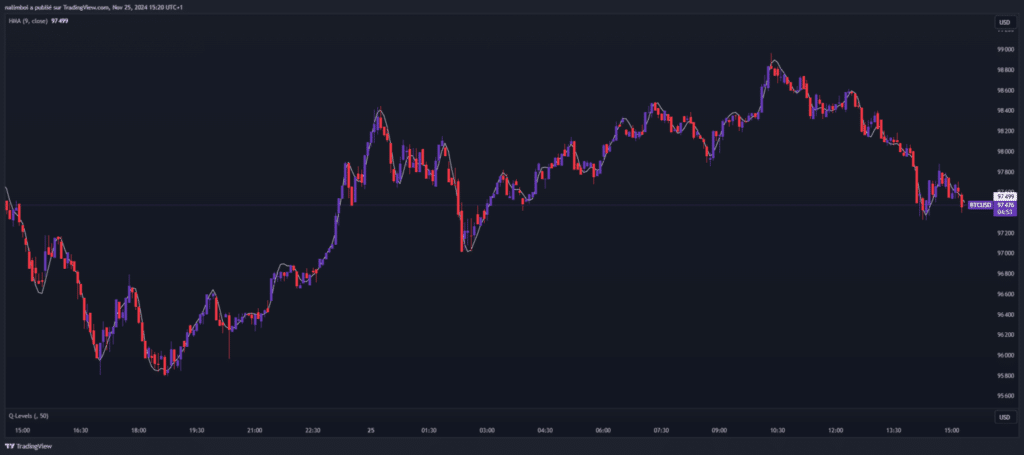
The moving average (MA) is one of the most fundamental and widely used indicators in crypto trading. It smooths out price fluctuations to reveal the underlying trend, helping traders better understand the overall market direction. In cryptocurrencies, likely the asset class characterized by the highest volatilityVolatility The degree of variation in an asset's price over time., traders often combine short-term (e.g., 50-day) and long-term (200-day) moving averages to identify significant trend changes. Another powerful trend indicator is the Moving Average Convergence Divergence (MACD). This sophisticated tool combines two moving averages to detect momentum changes in the crypto market. Crypto traders use the MACD to spotSpot A market where assets are bought and sold for immediate delivery. buying opportunities when the MACD line crosses above the signal line and selling opportunities when it crosses below. The MACD is particularly useful in crypto markets due to its ability to capture rapid momentum shifts characteristic of volatile assets.
Oscillators
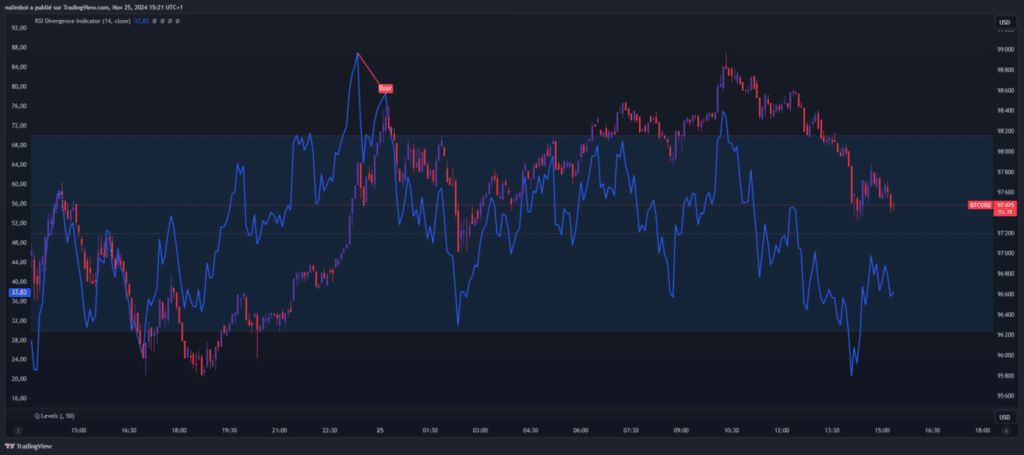
The Relative Strength Index (RSI) is an essential oscillator in every crypto trader’s toolkit. It measures the speed and magnitude of price movements. The RSI helps traders identify overbought conditions (typically above 70) and oversold conditions (below 30), thus anticipating potential trend reversals. In this context, where price movements can be extreme, the RSI offers valuable insights into market momentum. The stochastic oscillator is another powerful tool for traders. It compares the current closing price to a rangeRange The difference between the highest and lowest prices of an asset within a specific period. of prices over a given period, helping identify moments when a trend might be weakening. The stochastic oscillator can help spot entry or exit opportunities before they become apparent to most traders.
Volatility Indicators
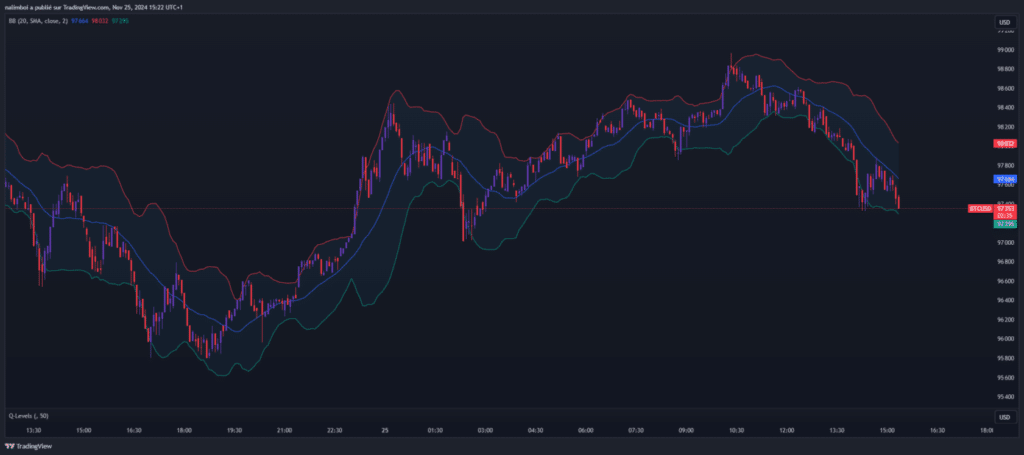
Bollinger Bands are particularly relevant in understanding volatility regimes as they create a channel within which prices typically trade, allowing traders to identify periods of low volatility (tight bands) that often precede significant moves. The goal here is to anticipate volatility explosions and adjust strategies accordingly.
The importance of volume
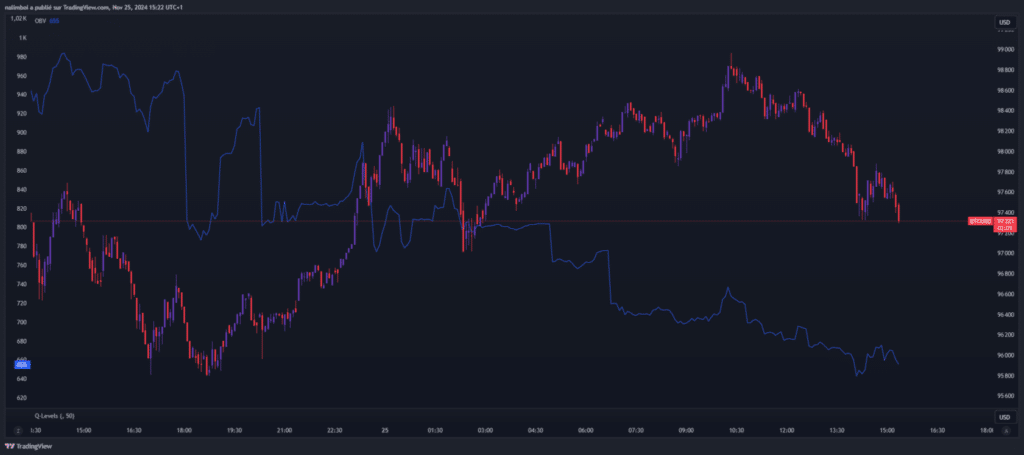
Although not explicitly mentioned in the sources, the On Balance Volume (OBV) indicator deserves particular attention. OBV links volume with price changes, helping confirm trend strength or anticipate reversals. During periods of BTC/ETH ETF rebalancing, where inflows may be significant, OBV can provide valuable insights into underlying market dynamics.
Strategies for using indicators
To make the most of technical indicators in trading, it is crucial to adopt a holistic approach. Combining different types of indicators can provide a more comprehensive view of the market, enabling more informed trading decisions. For example, a trader might use the MACD to identify general trends, the RSI to assess momentum, and Bollinger Bands to measure volatility. It is also important to note that since cryptocurrencies are more volatile than traditional finance (tradfi), indicator parameters often need adjustment. What works in stock or forex markets may not be directly applicable to cryptos. Therefore, each trader must experiment with and optimize their indicators based on each crypto’s unique characteristics. The use of technical indicators should always be complemented by an in-depth analysis of price action; signals generated by indicators are truly powerful only when confirmed by actual market behavior.