Selling Options
A common mistake among beginner traders when they start speculating on the buying or selling of options is thinking that selling options is “free money.” The reason many fall into this trap is simple: according to many sources, “90% of options expire worthless.” Let’s quickly see why this statistic is misleading before introducing you to the intricacies of selling options.
Indeed, data from the Chicago Board Options Exchange (CBOE) indicates that only 10% of all options are actually exercised (most options traders buy options to speculate on their value, not to exercise them on the underlying value, hence the low number), over 60% are closed before expiration (again, most options traders buy options to speculate on them, not to hold them until expiration), and only about 30% expire worthless. Therefore, selling options is far more complex than it seems.
Before anything else, a refresher on the nature of selling options is certainly useful for beginners:
So, what is selling options?
Remember the definition of an option: it’s a product that gives the buyer the right to buy or sell the underlying assetAsset Any digital asset, including cryptocurrencies. if it expires ITM, in exchange for a premium paid to hope for this right.
In other words, you pay a premium to buy a right, and conversely, you are paid a premium when you sell this right. Essentially, you are exposed to the obligation to fulfill your part of the contract if the option expires ITM.
Selling an option simply means betting that it will expire OTM, and thus worthless. This is why this product can be more interesting in some cases than others.
Typically, you’ll understand that the supply and demand dynamics in the options marketMarket A place where assets are bought and sold. are similar to those in “traditional” markets: one party makes a bet and pays another party to take the opposite bet. If one wins, the other loses, and so on.
With options, additional factors are time and volatilityVolatility The degree of variation in an asset's price over time., which we’ll cover later.
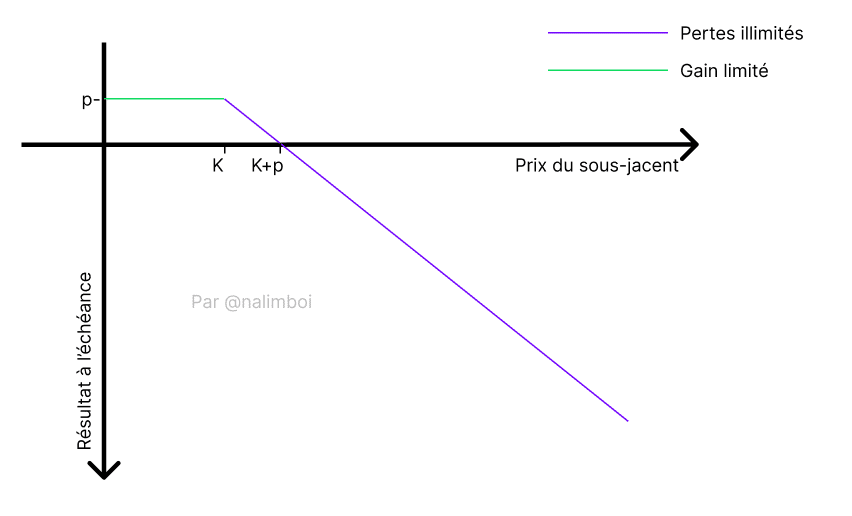
Here’s a graphical representation of this bet when selling a call option: as long as the option seller does not see the strike price surpassed (here K), they retain their profits from selling premiums to the option buyer. K is the strike price and p is the premium.
It is easy to see that in the case of selling options, profits are comfortable when the option expires OTM but remain limited. Often, you’ll see the expression “collecting premiums” to indicate a successful option sale for the seller.
However, losses can be potentially unlimited. The danger is mainly believing that selling options represents “free money.”
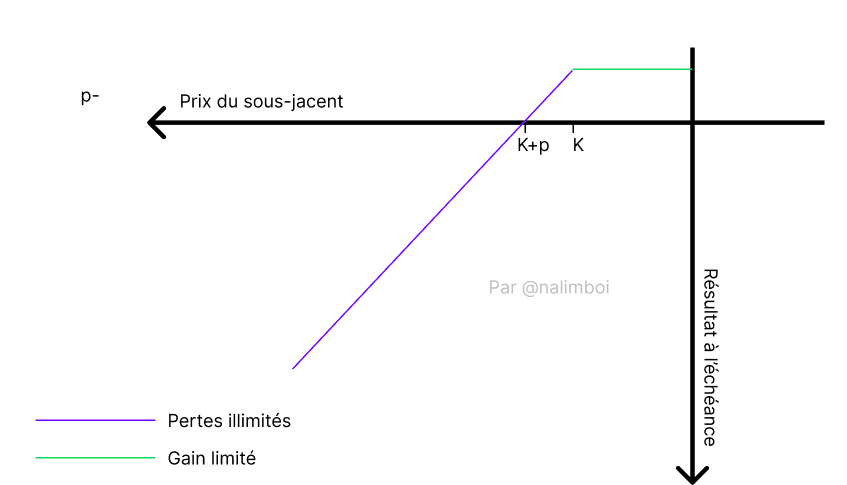
Now, to see the difference between the two possibilities of selling options, here’s that of selling a put option:
Understand that selling options exposes you greatly to volatility, and the further the expiration date, the more likely you are to have to fulfill your part of the contract.
But what happens if your prediction turns out to be wrong and the option expires ITM?
Volatility
In fact, when you speculate on option prices, you are primarily speculating on the anticipated or expected volatility (IV = Implied Volatility).
In other words, the higher the expected volatility, the more expensive out-of-the-money (OTM) options become, and the same goes for the reverse: the lower the market’s anticipated volatility, the more expensive at-the-money (ATM) options are.
But first, let’s return to the basics: what is volatility?
According to Wikipedia, “Volatility is the extent of variations in the price of a financial asset. It serves as a parameter for quantifying the risk of return and price of a financial asset. When volatility is high, the possibility of gain is greater, but the risk of loss is also higher.”
Volatility is a concept that seems simple at first glance, but be careful not to confuse it with volume, which are two different things.
Expected volatility (IV) is the result of calculations and the market’s overall perception of future movements in the markets. It thus serves as a means to protect against potential losses when hedging or to expose oneself when speculating and maximizing gains.
But how is it calculated?
Despite its complex appearance, this equation is probably one of the greatest advances in modern market finance and allowed the mathematicians who formulated it to introduce option pricing into the strategies of major players.
Black-Scholes serves as the foundation for many ways of understanding volatility in the markets. It is from this equation that IV can be calculated. Fortunately for you, you probably won’t need to use this equation directly as many websites or applications already handle it.
Several conditions are required for the formula to be as close to reality as possible:
Conditions:
-
-
- The average returns of the studied asset must be distributed in a ‘normal’ or ‘log-normal’ manner (see the section on the normal distribution).
- The studied market is efficient, and thus by definition, movements are random (see the section on market efficiency).
- There are minimal or no entry or exit costs; no actor should be discouraged from taking a position due to fees.
- The option is European, meaning it can only be exercised at expiration.
-
However, as you might guess, these conditions are not always met simultaneously. This can result in a sometimes biased IV calculation, which we will discuss further below.
Now let’s look at the variables involved in solving the equation:
Variables:
-
-
- r = risk-free rate interest
r is the interest rate at which one can invest and generate risk-free income in the economy. In most cases, the calculation is done using T-bills since they represent one of the few ‘risk-free’ investments. This variable is used to determine if a strategy is viable over a year: if the strategy involves risk and the expected return is lower than r, the strategy is essentially useless. Note that there are alternatives to T-bills such as LIBOR or the Prime Rate, which may be more suitable in certain cases. - t = time until expiration
The expiration time is simply the period remaining until the option’s expiration, calculated annually. - x = strike price
The strike price for an option is the price at which the option can be exercised by its holder. - s = price of the underlying asset
s represents the price of the underlying asset at the time we want to solve the equation. - σ = volatility
σ is the last variable in this equation because it is usually the one we do not know and are trying to find. By inputting the other variables into the equation, we can deduce the expected volatility or Implied Volatility (IV) or sigma (σ). Be aware that IV is derived from the option prices and other variables, not the other way around.
- r = risk-free rate interest
-
IV vs HV:
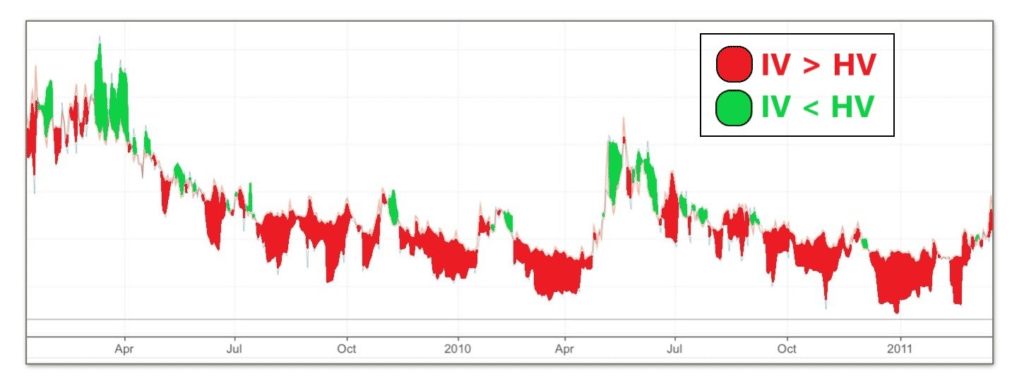
However, time has shown that the equation does have its limits: the model seems to consistently overestimate volatility. Since 1990, IV has overestimated 83% of the S&P 500 return days. In other words, expected volatility (IV) is about 4 to 5 times higher than historical volatility (HV).
These various graphs also aim to illustrate my point:
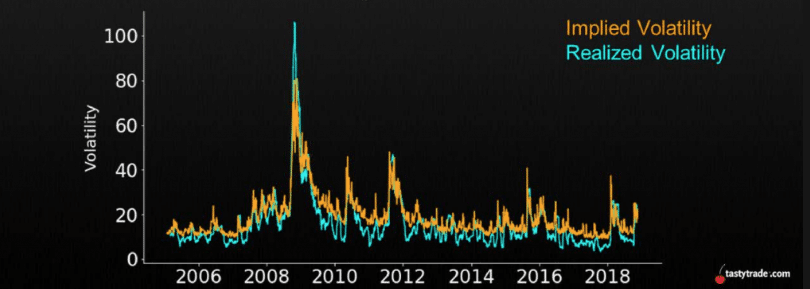
It is possible to speculate on the reason for this discrepancy. Some say it is due to the constant need for companies or funds to hedge, which pushes the demand for put options up, leading the Black-Scholes model to exaggerate these situations. Others believe it is proof of a theory that is as fallible as it is theoretical, or that optimal market conditions (market efficiency) are not always met. One might also consider the condition of costs, which is not met due to lack of liquidityLiquidity The ease with which an asset can be bought or sold without affecting its price. in the markets for some funds.
The truth is that the direct consequence of interpreting this statistic leads to a simpler conclusion: option sellers always have a slight statistical advantage over buyers.
Be cautious, this advantage is purely statistical and empirical: history may repeat itself or change, what happened yesterday may not necessarily happen tomorrow. It is possible that this year and for some time, option sellers may be at a disadvantage, as the opposite can also be true.
In short, it is up to individual interpretation to determine if and when history will repeat itself.


